Back to all articles

Boost Sales Efficiency with Geospatial Customer Optimization

SE
Shaun Enslin

In today’s competitive landscape, understanding your customer base is paramount to driving sales growth. Traditional marketing approaches often rely on broad segmentation, which can lead to inefficient resource allocation and missed opportunities. However, with the rise of geospatial data and advanced machine learning algorithms, businesses can now achieve a far more granular and targeted approach to customer optimization. This article explores how K-Means and K-Nearest Neighbors (KNN) can be leveraged to unlock valuable insights from location-based data, ultimately boosting sales efficiency.

K-Means clustering is a powerful unsupervised learning technique that groups customers into distinct clusters based on their geographic location and associated characteristics. By analyzing customer data such as purchase history, demographics, and online behavior, businesses can identify high-potential areas for targeted marketing campaigns. For example, a restaurant chain could use K-Means to identify neighborhoods with a high concentration of potential customers and tailor its promotions accordingly. Similarly, a retail company could use this technique to optimize store placement and inventory management based on regional demand. This allows for hyper-localized campaigns, significantly increasing ROI.

KNN, on the other hand, is a supervised learning algorithm that predicts the category or value of a new data point based on the characteristics of its nearest neighbors. In the context of geospatial customer optimization, KNN can be used to identify customers who are similar to existing high-value customers. By analyzing the location and behavior of these similar customers, businesses can gain insights into the factors that drive customer loyalty and identify opportunities to replicate those factors in other areas. This can be particularly useful for understanding the impact of local events, competitor activity, or seasonal trends on customer behavior. Using KNN alongside K-Means creates a predictive model for customer behavior based on location.

Integrating K-Means and KNN with geospatial data provides a comprehensive solution for optimizing sales efforts. By combining the clustering capabilities of K-Means with the predictive power of KNN, businesses can gain a deeper understanding of their customer base and make more informed decisions about where to focus their marketing investments. Furthermore, the ability to visualize these clusters on a map provides a clear and intuitive way to communicate insights to stakeholders and track the effectiveness of optimization strategies. Ultimately, this data-driven approach leads to increased sales, improved customer satisfaction, and a stronger competitive advantage. Companies can use this information to proactively address customer needs and anticipate market trends, leading to sustained growth.
Geospatial Customer Optimization

Gain a competitive edge by integrating geographical insights into your sales strategies, resulting in substantial cost reductions and enhanced sales performance.

Introduction

What happens in most companies, is you start off with a GREAT spread of customers over your sales force. Then, over time, the waters get muddied and a few years down the line you probably have something similar to figure 1.

Note: The different colors denote different reps and see how much they overlap. This article will deal with sorting this mess out.

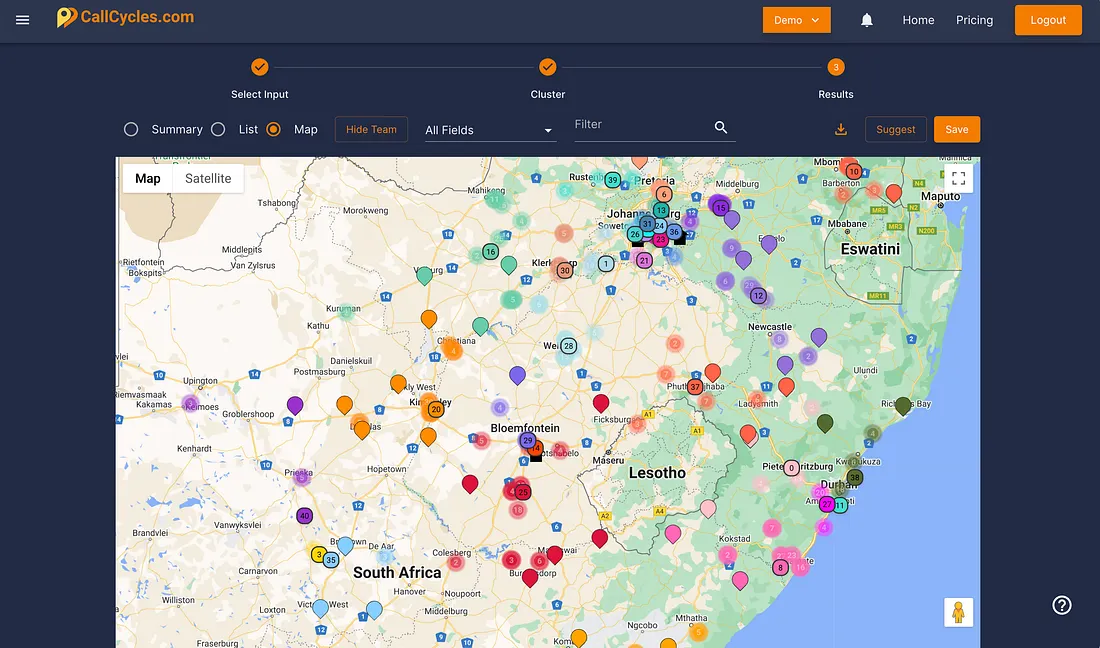
For a stress-free solution, check out callcycles.com. Say goodbye to coding as we've got you covered, and then some.

Sales force geographically spread
Figure 1: sales force geographically spread

Required packages

We will be using KMEAN's as our initial algorithm to group the customers according to their locations. However, usual KMEAN's doesn't quite do the trick in our scenario, since KMEAN's can end up with very unbalanced areas. One rep could end up with 20 customers and another could end up with 150. So k-means-constrained to the rescue. We can give minimum and maximum for each area. So, first up, install using pip.

pip install k-means-constrained

Now, let's import the packages we need:

import numpy as np
import pandas as pd
import matplotlib.pyplot as plt
import folium
from k_means_constrained import KMeansConstrained

Importing your data

Now import your data into a data frame as I have below in figure 2. I have blocked out some data, but you get the point, you need the following fields:

Dataframe example
Figure 2: Dataframe once it's populated

Plotting the initial data

You can use the code below to plot the existing customer base with each representative as a different colour.

Initial plot showing rep overlap
Figure 3: note the overlap of representatives

Training parameters

Let's set up our training parameters:

KMEAN's to cluster our customers

Now, let's set up our KMEAN's parameters and run fit_predict. Importantly, we will want to save the centroids for each cluster. In our case, each centroid will be a central location for each representative's area or territory.

Results after KMEANS clustering
Figure 3: Results of KMEANS

Assign each cluster to the most common representative

A little like the highest common denominator, let's use an APPLY to find the most common representative in a cluster and assign them to the whole cluster.

Customer count per rep

So, what's the problem?

Well, KMEANS-constrained is great, but the constraints now cause a few outliers which we can use KNN to resolve. Figure 5 highlights the issue for you. Can you see one customer assigned to the brown representative, BUT it doesn't make sense…. It should actually be with the purple representative.

Easy to spot on a map and let's use KNN to resolve this.

Outlier problem

KNN to the rescue

First up, let's setup a train and test dataset. Now that we classified our data using KMEAN's, let's train a KNN model to predict based on the KMEAN's results. This will help us with the following:

Now that we trained, let's run a prediction on our test set and then measure accuracy. We should see above 92% accuracy of our model.

Predict on ALL data

We have a KNN model, so let's predict for latitude/longitude on our entire dataset. This will help show us some outliers where KMEAN's made an odd choice due to the constraint of min/max customers per rep.

Results with outliers identified
Figure 6: Results with outliers identified

Let's plot the new results

Now let's plot our results to see if KNN solved our outlier problem. Great, as you can see in figure 7, our outlier has been reassigned to the purple representative. Note, we do give it a black border so we can easily pick the outliers out.

Final results with outliers fixed
Figure 7: Final results with outliers fixed and repositioned

Conclusion

In conclusion, optimizing your sales force territories can be a complex task, but with solutions like leveraging machine learning or visiting www.callcycles.com, you can streamline the process and maximize efficiency.

If you find the task daunting, head over to www.callcycles.com for a hassle-free experience. Let us take care of the details so you can focus on what matters most — driving your sales force towards success.